
We recently ran a massive 30-year backtest for EquitAI. The results were visually staggering: a theoretical $10,000 initial investment turned into $1.37 million. We crushed the S&P 500 by an unimaginable margin.
It was the ultimate marketing material. We could have slapped a paywall on that chart and started selling premium memberships the very next day. Many platforms in the fintech space do exactly that.
But we didn't.
Because as engineers, our first instinct wasn't to celebrate; it was to question it. While our broader mission at EquitAI is to build a transparent, data-driven research ecosystem, before bringing users onto the platform, we had to prove a fundamental concept to ourselves: the true correlation between our proprietary Financial DNA scores and actual market profitability. We had to be absolutely certain we wouldn't mislead investors into financial traps.
No Black Boxes, Just Pure Data
To ensure complete transparency and avoid the "Look-ahead Bias" that plagues predictive AI models, we stripped our initial testing strategy down to its bare essentials. We solely relied on two pure, immutable data points:
- Wall Street Analyst Targets (Consensus)
- Our Financial DNA Scores
We simulated a simple strategy: each month, the portfolio would identify the top 20 stocks based on these combined metrics, hold them in equal weights, and rebalance the following month. Even with this basic setting, the numbers looked too perfect. In quantitative research, when something looks flawless, you try to break it.
The "Monkey Test" and the Invisible Graveyard
We decided to stress-test these results against Wall Street's famous "Monkey Test." We defined our testing universe as the constituents of the S&P 500, S&P 400, and Nasdaq 100 indices. We then generated a strategy that picked stocks completely at random from this universe.
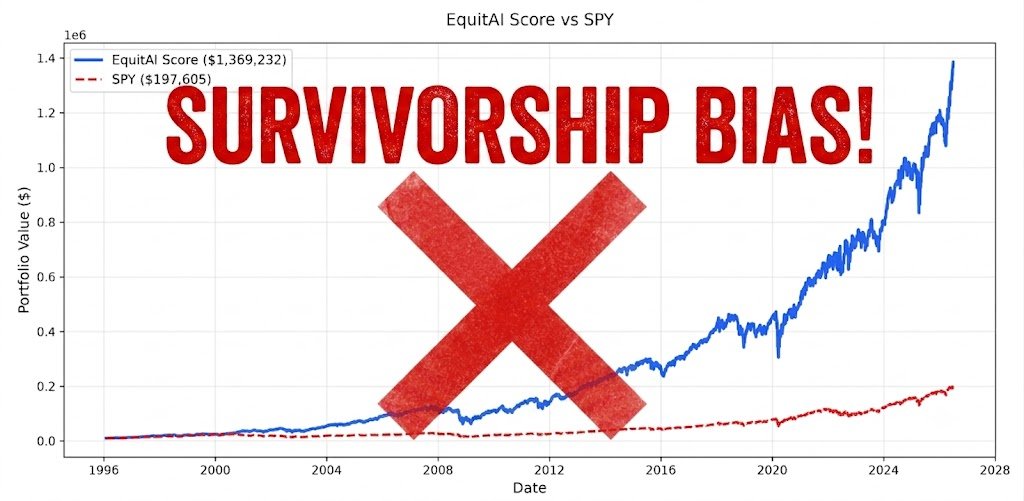
The results were absurd. Our DNA strategy generated a +11,716% Alpha against the S&P 500 over 30 years. But the randomly picking monkeys also "beat" the market, generating a ridiculous +9,246% Alpha. When random selection generates an impossible return, the problem is not the strategy; it is the data.
This is the power of Survivorship Bias. Our data provider claimed to offer point-in-time financial data. But when we dug into the raw pipeline, we found a massive hole in the earlier decades. The companies that went bankrupt, got delisted, or dissolved during the Dot-com crash or 2008 had been silently swept under the rug. If you only test your strategy on the "survivors" that are still active today, even a monkey throwing darts will generate massive Alpha by effectively predicting the past.
Cleaning the Lab: The 12-Year Reality Check
We realized we couldn't trust this biased historical record. We had to build our own testing framework, scrape the data ourselves, and isolate the cleanest 12-year period (2014-2026) where Survivorship Bias and Look-ahead Bias could be rigorously minimized.
In this sterilized environment, the contrast was brutal.
When we ran the "Monkeys" (random selection from the defined universe) through this clean data, the illusion shattered. The random picks were slaughtered by the market, generating a -174% Alpha. This is what a real, unforgiving market does to random chance.
But what about the actual EquitAI strategy using WS targets and DNA scores? In this exact same unforgiving dataset, our top 20 picks generated a net +87.36% Alpha against SPY.
The True Benchmark: Why the S&P 500 Comparison Isn't Fair
If you look around today, every other fund claims to "beat the S&P 500." But lately, this has not been a fair fight. The S&P 500 (SPY) is a market-cap-weighted index. Its entire performance has been carried on the backs of just a few giant tech companies (The Magnificent 7).
To prove true stock-picking capability among the other hundred stocks, an algorithm must be benchmarked against a more relevant opponent: The S&P 500 Equal Weight Index (SPXEW). In this arena, every company has the same weight. You have to actually read the financial genetics of the broader market to win.
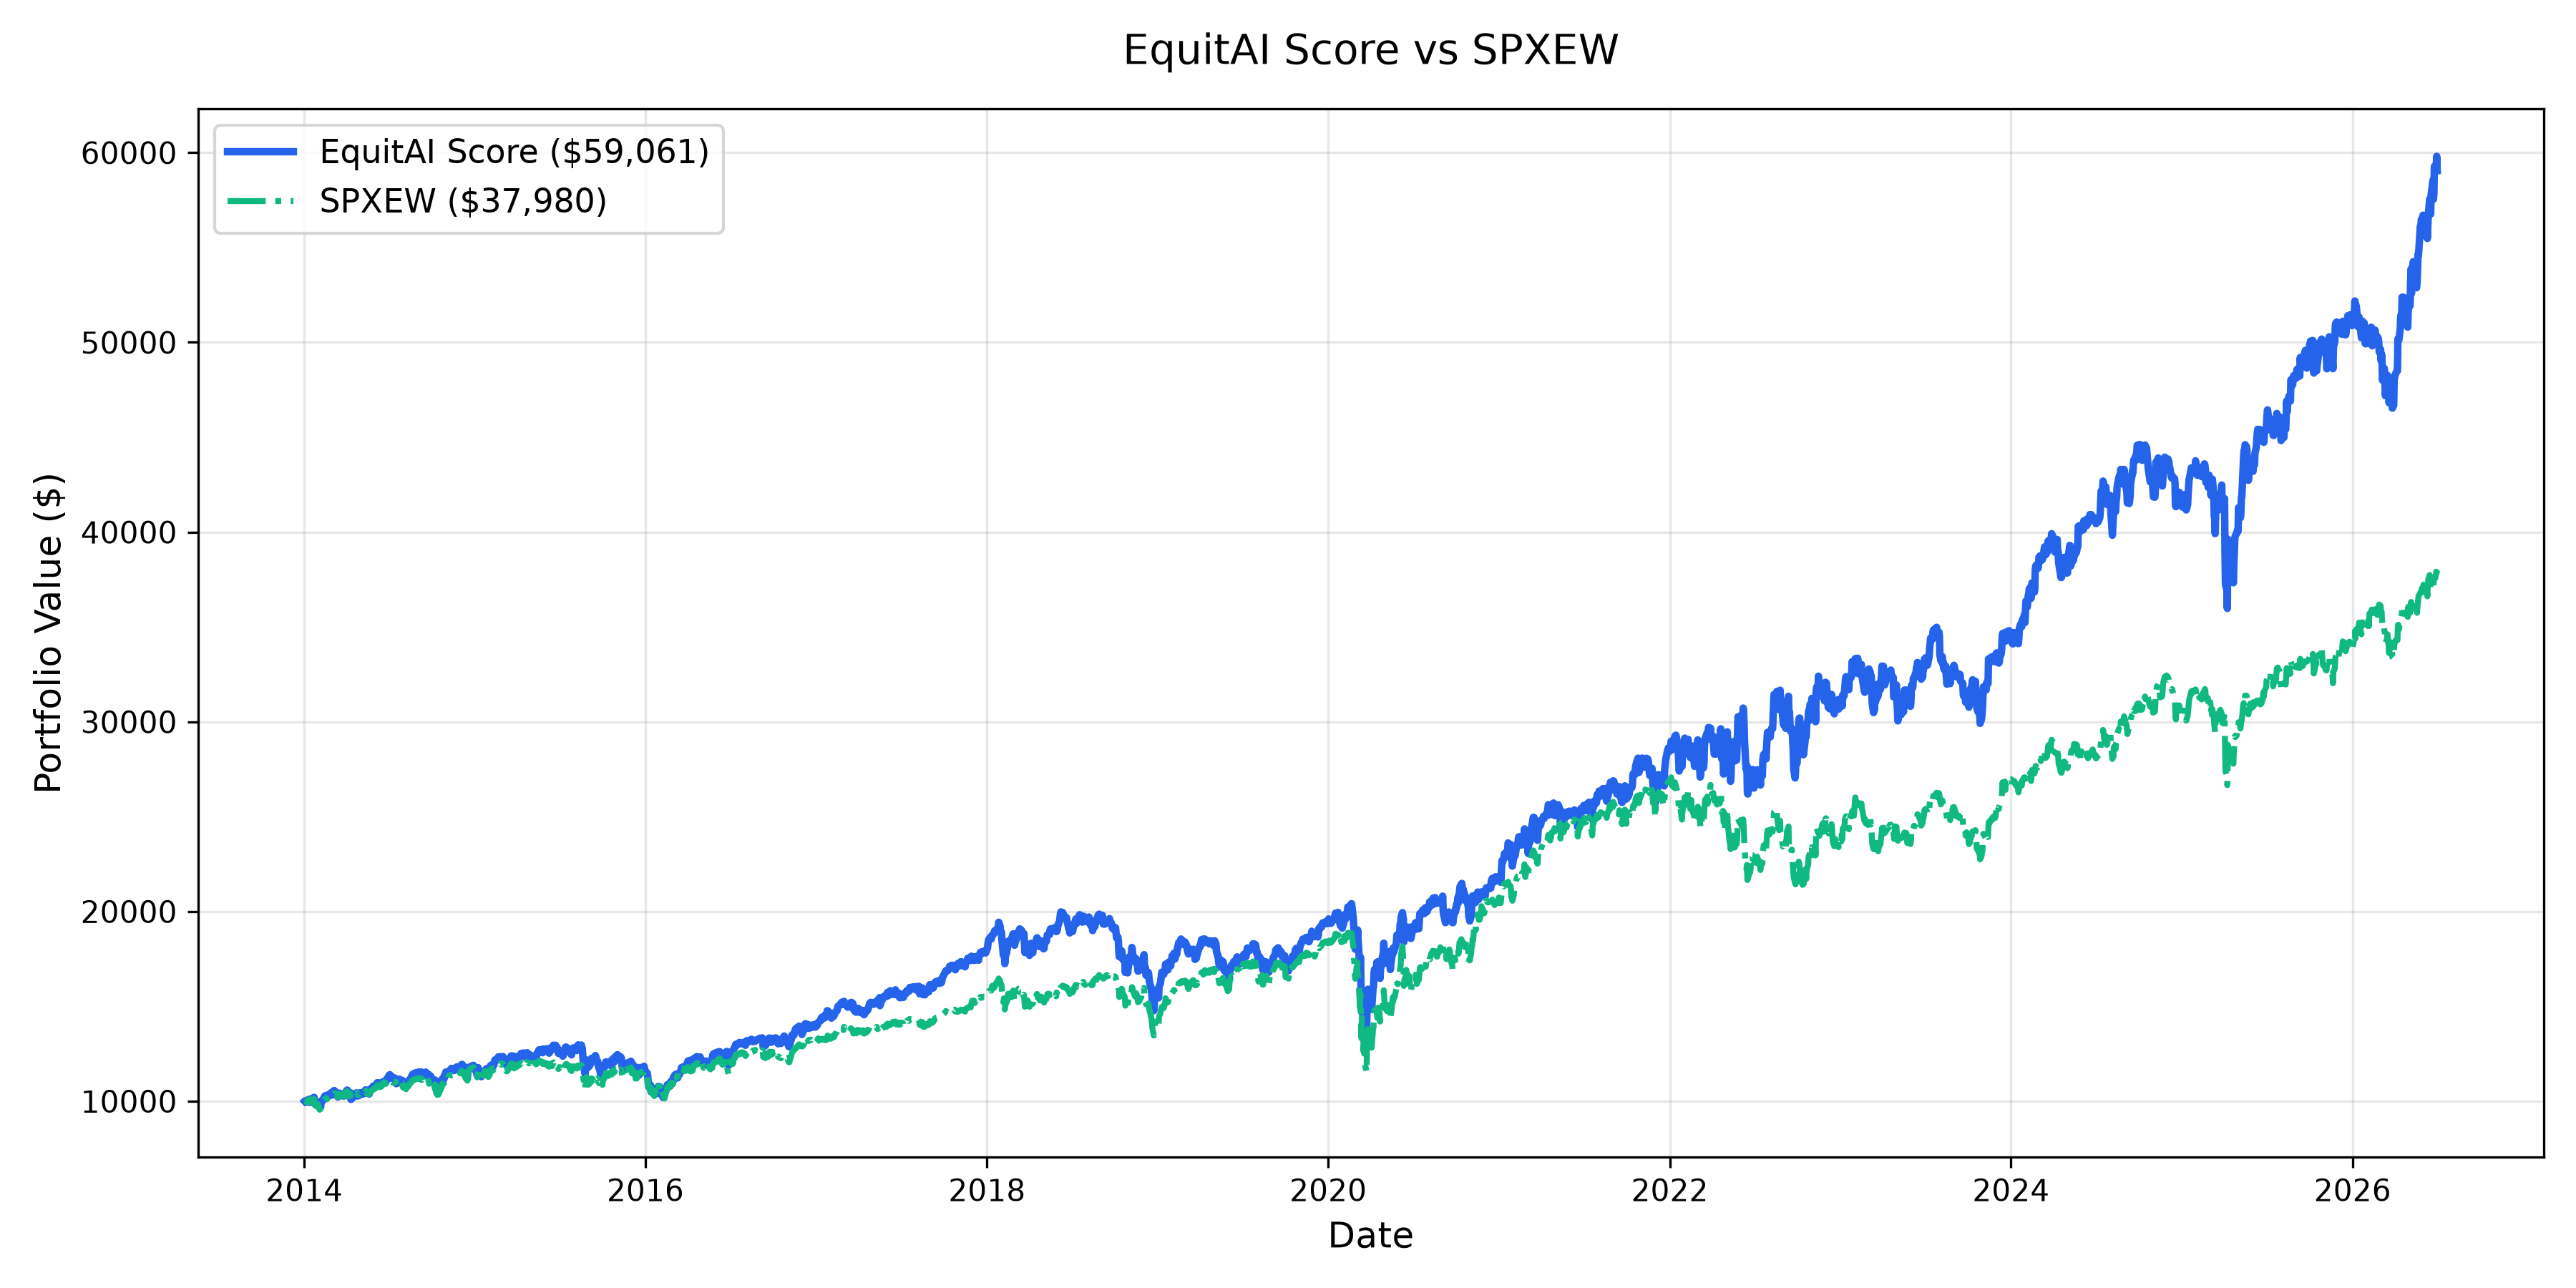
Our results in the 2014-2026 period confirm that our Alpha came from identifying healthy companies across the entire universe, not just riding a tech momentum wave. While SPXEW generated a +279.80% ROI, the EquitAI strategy produced a +490.61% ROI, resulting in a massive +210.80% Alpha against the Equal Weight Index.
Transparency First, Always
This journey confirmed a critical principle for us. Many backtests you see on the internet are based on invisible graveyards or optimized "curve fitting." We refuse to sell those illusions.
Our Financial DNA scores are not a crystal ball. They are designed to act as an honest, data-driven radar to help you dodge "Value Traps"—the companies that look cheap but are fundamentally broken—by reading their raw financial health.
This specific backtest phase is complete. Now, we continue to gather time-stamped, live market data for our ongoing forward tests. Our journey is just beginning.
Ready to find out where you stand? Join us by building your profile and discovering your own Investor DNA today: Discover Your Financial DNA